Jan 2015
Jan 2015
Try it. Look at the next 3 charts and tell me the pattern.
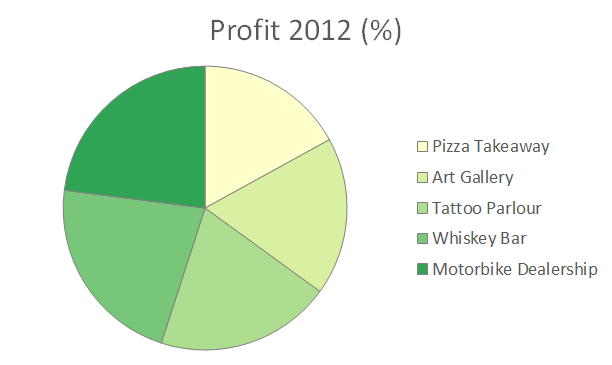
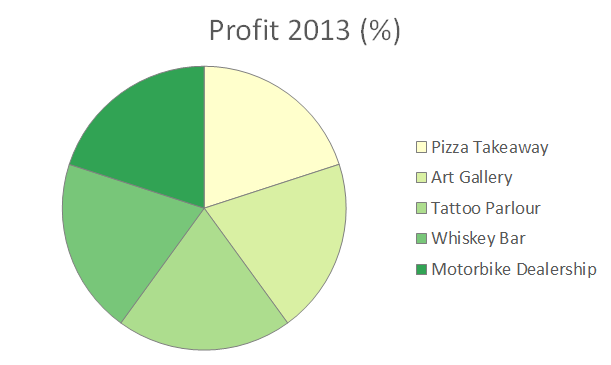
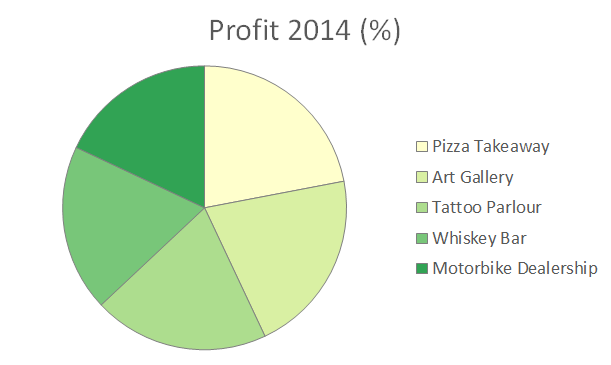
If you're anything like me, you spent the best part of a second looking at the charts before getting bored. They're not really worth spending anymore time on, are they? Maybe, if they were your profit margins, you'd concentrate harder. But still, they're not optimal.
Now look at the same data, plotted in bar charts. Easy to see the pattern, huh? We're good at quickly measuring the length of things - maybe from the days when we had to throw spears at wolly mammoth - and this is aided even more by including horizontal gridlines (not so easy to do on a pie chart).
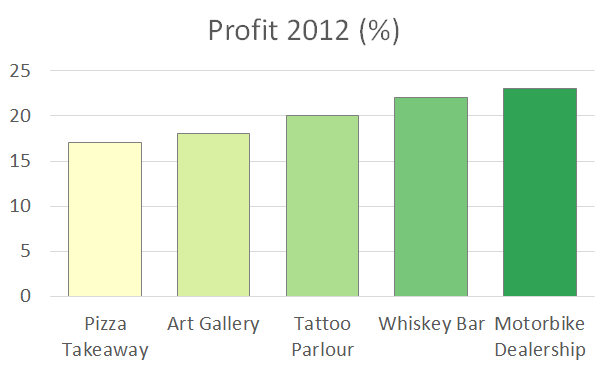
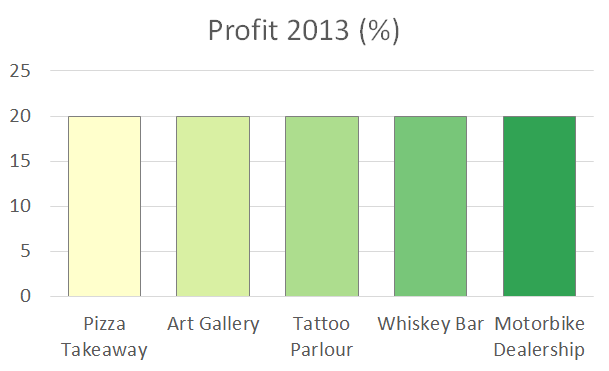
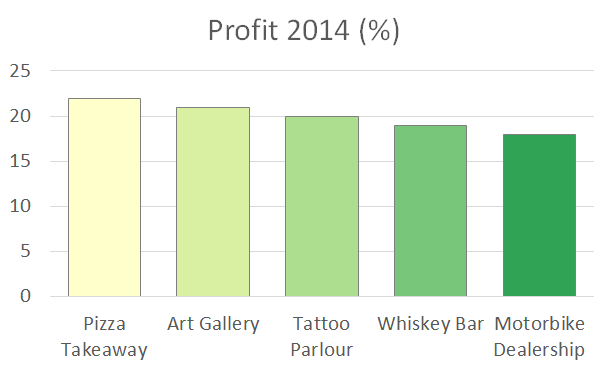
Hopefully you're nodding along with me now. I'm not done though, let me stick the knife in.
Because you can't (nicely) label each slice, you need to use a legend and different colours for each slice. The problem is that different shades can make an item look bigger, or smaller, than it really is. So going back to the the 2013 pie chart, the lighter 'Pizza Takeaway' slice looks bigger than the 'Motorbike Dealership' slice, even though they are the same size. With all these extra colours you need to work really hard not to distort the data. Also, the more slices you have, the more colours you need. Soon you'll exhaust your brand palette and have to bring in random colours, ruining the consistency of your beautiful report. Colour is an extra dimension in a chart, used to explain another variable. In a pie-chart, however, you're forced to use colour without explaining anything new. What a flippin' waste!
When looking at an array of pie charts (as in our example), you can't apply the spatial information that you learned from the first chart, to the subsequent charts. Take the 'Whiskey Bar' slice, for example, it moves position from chart to chart because the preceeding slices changed size. You have to rely solely on the colour to identify the slices. With the bar chart, it's really easy to predict where the 'Whiskey Bar' bar will be; it's in exactly the same place on all three charts.
The first chart below is a regular pie chart, of footballers wages. Look at all those shades of green and yellow that I've had to use. Note the extra 'cognitive friction' now that the top legend item doesn't correspond to the top, 12 o'clock slice. It's hard work to match up the legend with the pie, huh? Especially with all those colours. Once you've figured out that Lionel Messi's slice is at the 6 o'clock position, you can start moving down the legend and reading across to each footballer's slice in the pie. With a bar chart, we could have just labeled the footballer on the x-axis, making this process way easier on the user.
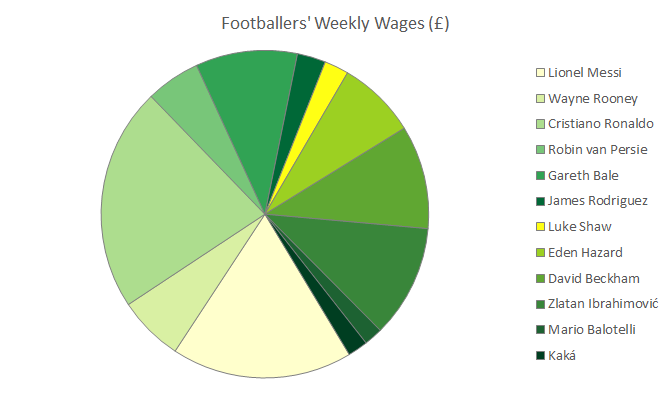
Now time for the magic, let's transform this into 3d.
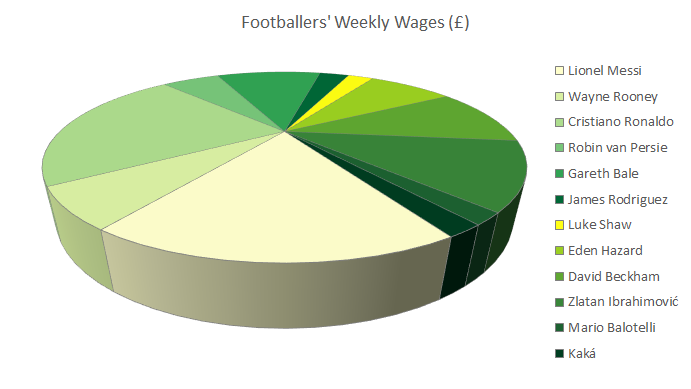
Now it looks like Lionel Messi is the best paid footballer. In fact, he only earns a paltry £770k / week, compared to Ronaldo's £950k. Oooooh, so deceptive.
There are actually 2 times when pie charts are good to use
This donut chart, from The Times newspaper, is a great example.
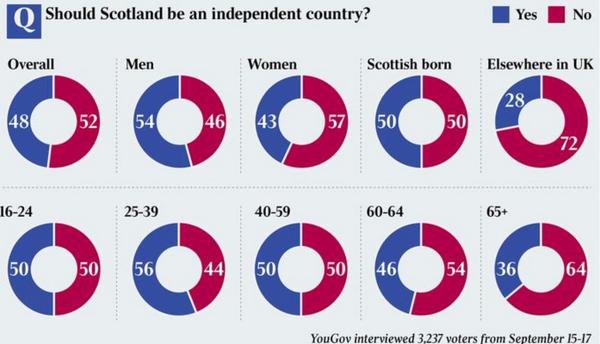
If you want to draw some donuts/pies (demo), check out my experimental library , which is build on top of d3.js.