Oct 2014
Oct 2014
I've copied the above chart (plotted in Excel) from the Jersey in Figures booklet and will iterate through alternative visuals, progressing to a funkier final version. First up, my eye is initially drawn to the data markers - the squares and triangles. They are an extra dimension (shape) of the data without describing anything new, so let's remove them:
With no markers, and slightly thicker lines, the chart is now less noisy. The markers do serve one bit of information, and that is to explicitly indicate that the underlying data is discrete, rather than continuous. We'll have to remember to update the legend (final iteration of this post) to specify this fact and keep our integrity with the viewer!
Point-to-point lines, like this one, tend to be jagged which also adds to the visual noise. We can smooth out the lines slightly, making them easier to view while maintaining all the trend information of each line, and the relative patterns between the lines. When we do this we perform what is called an interpolation, which means that we construct some new data points (given the ones that we already know), providing the values to plot a nice smooth, curvy line. Technically some of the data points may move, so 841 deaths in 1994 could get shifted to 843 deaths, to make a smooth curve. This is fine though because 1) We are still keeping the relative integrity between the 3 time-series (by performing the same interpolation on all lines). 2) The pattern produced by each individual line is still the same. 3) In percentage terms, the change is tiny. So small that you wouldn't actually be able to read it off the graph anyway.
As we can see, it's now a bit easier on the eye and we haven't lost any information. Next up, let's change the deaths to a negative value. Since population is negatively impacted by death, I find negaitive values an easier way to interpret these numbers... However, this may be a personal thing, YMMV! If the Natural Growth time-series wasn't included in the chart, then we'd definitely want to keep death as a positive number (to make it easier to infer the growth) but, as it stands, we can switch out the sign.
Having the x-axis in the middle of the chart has made things a lot messier! Rather than doing another Excel iteration to fix this, we will bid farewell to Excel and get out the big gun - d3.js.
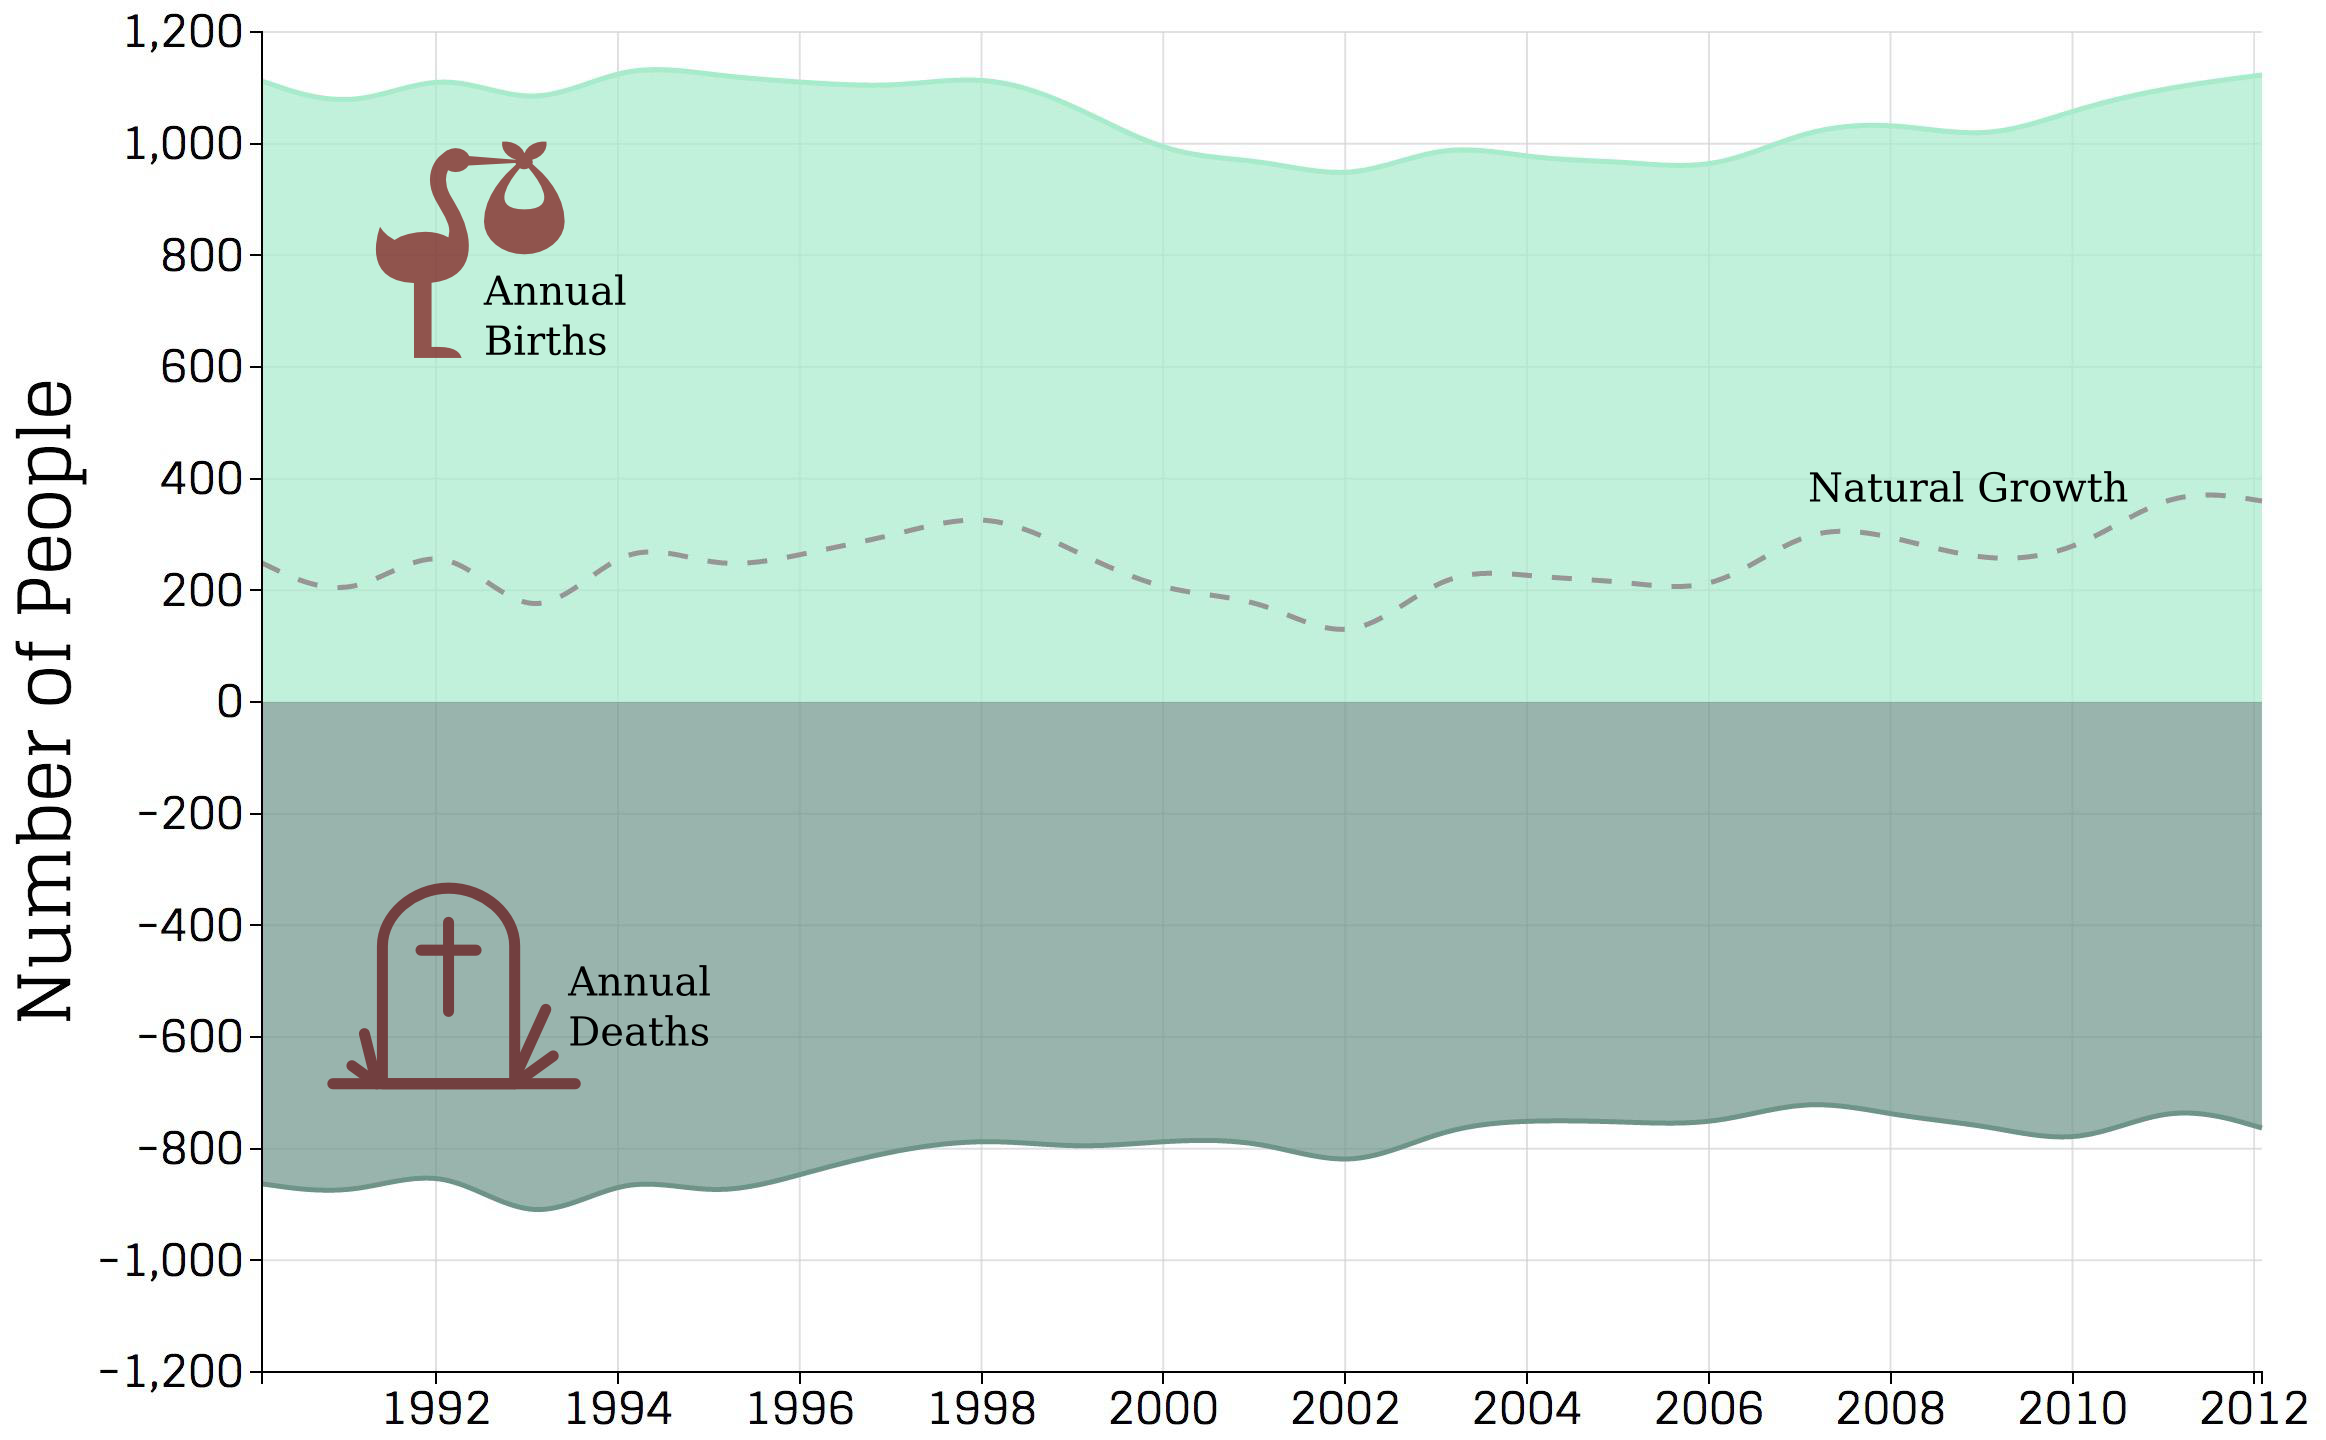
The first d3.js iteration sees a few new changes in. With the positive/negative separation between the lines, we no longer need a colour dimension to indentify the time-series. Using a light green for births and and dark green for deaths we've made the chart a bit easier on the eye and colour-blind friendly too! Since we dramatically increased the distance between the births and deaths lines, it made it harder to line common dates up, vertical gridlines help here. Finally, the most noticeable change is the the shading. I find this more aesthetically pleasing and it is also a subtle way of associating the births and deaths lines into one logical group and the (unshaded) growth line into a separate logical group.
Furthermore, making the growth line dashed means that we can make it even more obvious that it is a logically different time-series from the other two - a derived time-series. Finally, adding the legend back in (making the point that these are annual values, to make up for removing the discrete marker points at the beginning of this post) along with some SVG images, we're done!

I hope that you enjoyed following this thought process on modifying an existing chart. I plan to do a few more of these posts over the coming months. Follow me on twitter -@ninjaPixel- to find out when my next post is and to suggest what you'd like to see next.